Chandana Arutla
AI/ML Engineer | Specializing in LLMs, RAG & Automation
Portfolio
About Me
AI/ML practitioner with hands-on experience in building LLM agents, RAG systems, and AI workflow automations. Skilled in creating startup-focused AI copilots, planners, and chatbots, with a strong base in Python, SQL, and automation tools. Previously worked on gaming analytics and medical AI, giving broad domain exposure. Focused on developing practical, human-centered AI systems that solve real problems.Desperately waiting to gain hands-on experience to combine tireless hunger for new skills with desire to exploit cutting-edge data science technology.
Education
Parul University, Gujarat [2020 – 2024]
Under Graduation: BTech, Computer Science Engineering with Specialization in Artificial Intelligence
Certifications
- IBM RAG and Agentic AI Specialization, Coursera
- Advanced Analytics, Swinfy Solutions Pvt Ltd
Technical Skills
- Operating System:
Windows - Programming Language:
Python,SQL,Javascript - AI/ML & NLP:
Supervised Learning,Unsupervised Learning,Feature Engineering,Text Classification,Sentiment Analysis,Model Evaluation - Databases & Retrieval:
MySQL,ChromaDB,Pinecone,FAISS,HNSW - LLM & Agentic AI Frameworks:
LangChain,LangGraph,LlamaIndex,LlamaParse,CrewAI,AutoGen,Ollama,OpenAI - Application Development:
Streamlit,Gradio,Django - Automation & Workflow Tools:
n8n,Airtable,OpenAI API,Gmail API - Other Tools/Platforms:
Excel,Google Sheets,Power BI,Jupyter Notebook,Google Colab,VS Code,Github
Projects
- Startup AutomationWorkflow [No Code]
Objective: Automate first-level startup operations (lead management, branding requests, and customer inquiries) to save time and ensure every incoming request gets routed correctly.
Tech & Requirements:
- n8n → workflow automation
- Airtable → database for leads + tracking status
- Email APIs → for automated responses
Workflow Features:
- Lead Segmentation
- Categories: Website Design, Branding & Logos, Landing Page, Email Automation, Social Media Kit, Personal Branding Strategy, AI Chatbot, Workshop Request, General Inquiry.
- Stored in Airtable with status (new, in-progress, done) + extra tracking columns.
- Automated Routing
- New form submission → automatically logged in Airtable.
- Conditional branching in n8n routes leads based on category.
- Sends personalized email replies with next steps.
- Notifications & Updates
- Team notified (Slack/Email) of new leads.
- Airtable updated with response timestamps.
Learnings:
- No-code workflows like n8n can replace weeks of manual work for startups.
- Airtable is a flexible backend but needs strict conventions for scale.
App Snippet:
Future Improvements:
- Add CRM integration (HubSpot, Notion, ClickUp).
- Track lead lifecycle beyond first response (follow-ups, conversions).
- Use AI (OpenAI/LLM) to draft more personalized replies based on inquiry text.
- Founder’s Local Copilot
Objective: A private AI copilot that answers only from startup’s own documents (policies, roadmaps, investor memos).
Tech & Requirements:
- Streamlit
- LangChain, LangChain Community, LangChain Ollama
- LangGraph (for workflow routing)
- FAISS + Sentence Transformers (for embeddings)
- Unstructured (for local doc ingestion)
Project Files:
- app.py → Streamlit app
- graph.py → defines app flow with LangGraph
- nodes.py → nodes for docs, advice, marketing
- rag.py → handles RAG ingestion, FAISS indexing
- model.py → LLM connection.
- utils.py → helpers
- requirements.txt → lists Python dependencies for the project
Challenges Faced:
- Handling FAISS index load/save correctly.
- Preventing the AI from hallucinating outside of documents.
Learnings:
- RAG improves accuracy but depends on good chunking & embeddings.
- Routing with LangGraph makes the system modular and expandable.
App Snippet:

Future Improvements:
- Add multi-doc support (PDFs, slides).
- Implement caching for faster retrieval.
- Expand beyond docs to handle integrations (email, Slack).
- Startup Advisor Chatbot
Objective: Help founders describe their current challenge and receive structured AI advice using multi-agent reasoning.
Tech & Requirements:
- AutoGen, AG2[OpenAI]
- Streamlit
- Ollama
- Fix-busted-json
Project Files:
- agents.py → defines advisor agents
- chat.py → chat interface
- health_code.py → checks outputs & prevents broken JSON
- main_app.py → Streamlit app
- model.py → configures LLMs
- requirements.txt → lists Python dependencies for the project
Challenges Faced:
- Ensuring consistent, valid JSON outputs for agent responses.
- Balancing general advice vs. context-specific insights.
Learnings:
- Using health checks reduced invalid responses.
- AI works better for structured frameworks rather than vague advice.
App Snippet:


Future Improvements:
- Add memory for ongoing conversations
- Provide references for advice (case studies, frameworks).
- AI Startup Planner
Objective: Build a multi-agent AI system that helps founders plan their startups with a refined idea, competitor search, market analysis, and action plan.
Tech & Requirements:
- CrewAI, CrewAI Tools
- LangChain, LangChain Community, LangChain Ollama
- Streamlit
- DuckDuckGo Search
Project Files:
- agents.py → defines agents
- tasks.py → defines roles
- tools.py → definse tasks
- model.py → connects LLM backend
- main_app.py → Streamlit app
- requirements.txt → lists Python dependencies for the project
- startup_kit_YYYYMMDD_HHMMSS.zip → Output folder with files: refined_idea.md, market_analysis.md, startup_plan.md
Challenges Faced:
- Prompt engineering needed for reliable competitor search results.
- Sometimes outputs were too generic or repetitive.
Learnings:
- Multi-agent collaboration improves reasoning quality.
- Trusting AI output requires cross-checking sources, especially in market analysis.
App Snippet:


Future Improvements:
- Add PDF/Excel export for plans.
- Enhance competitor search with APIs like Crunchbase.
- Streamlit Exploratory Data Analysis App
Objective: Create a one-line Exploratory Data Analysis (EDA) experience.
Working: This app analyzes the uploaded CSV files, providing in-depth insights into the dataset’s characteristics through exploratory data analysis techniques.
Features:
- Upload CSV: Allows users to upload their CSV files for analysis.
- Profiling Report: Generates an exploratory data analysis report using ydata_profiling.
- Example Dataset: Offers the option to explore an example dataset in the absence of an uploaded CSV file.
Libraries Used:
numpy: used for various numerical operations, especially in generating example datasets or handling numerical data within the analysis.pandas: used to read and manipulate CSV files, organize data into DataFrames, and facilitates data exploration and presentation.streamlit: used as the primary framework for building the EDA web application, allowing easy integration of data visualizations, user inputs, and data analysis tools.ydata_profiling: Used to create comprehensive and interactive exploratory data analysis reports based on the uploaded or example datasets, providing detailed insights into the data’s characteristics.streamlit_pandas_profiling: Facilitates the direct embedding of Pandas Profiling reports generated by ydata_profiling into the Streamlit app, allowing users to visualize and interact with the analysis within the app interface.
App Snippet:
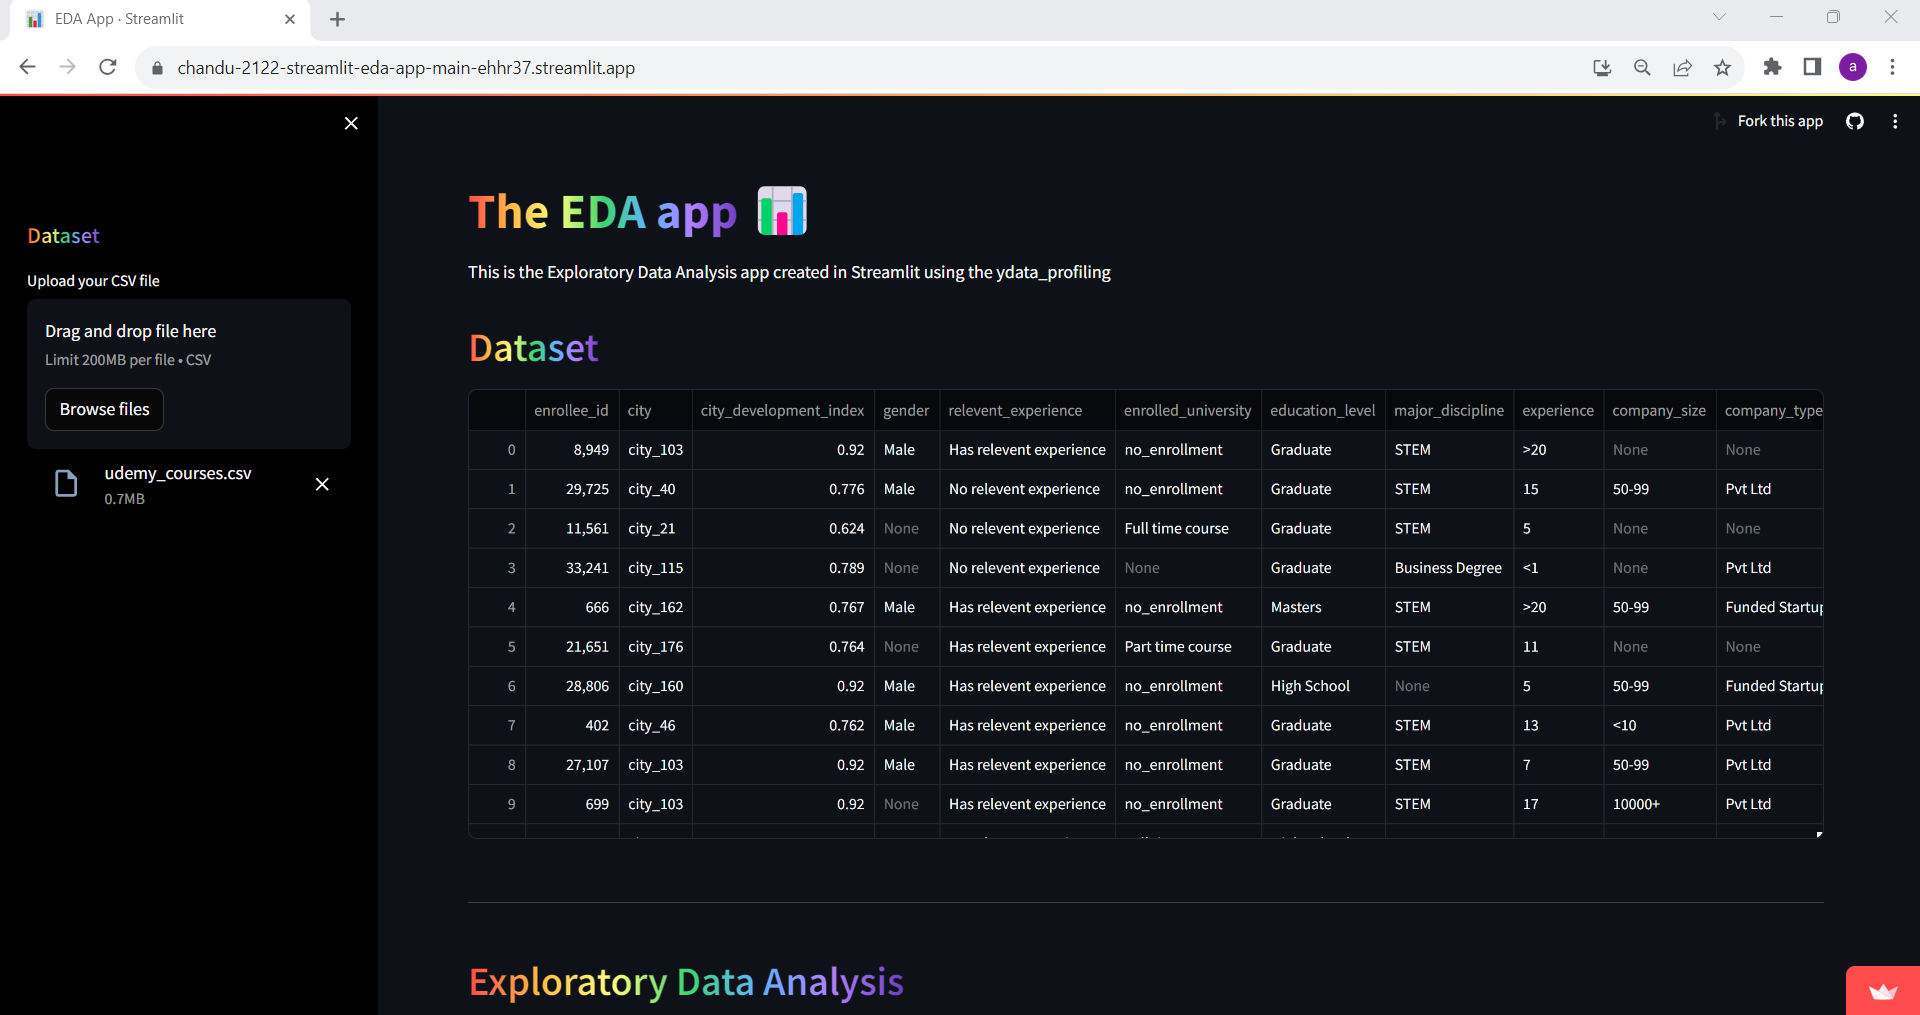
Result: Based on the uploaded CSV file or the example dataset, the EDA report is generated with the help of ydata-profiling and Streamlit on this app.
Conclusion: Streamlit framework made easy to build web application for machine learning by simplifying the creation of interactive and data-driven apps.
- Exploratory Data Analysis (EDA) on Rural Telangana Illiteracy Rates
Objective: Analyse the number of illiterates in Telangana during the year 2014 and compare it with the current year(2023).
Data Source: The dataset is taken from Open Data Telangana
Dataset Description: The dataset provides information about the number of illiterates in the rural areas of Telangana State by gender to gram panchayat level. This data is according to the old districts during the perioid 2014.
Dashboard Snippet:

Insights Gained:
- During the period 2014, the top 3 highest number of illiterates according to the old districts were in Rural Telangana from Mahabubnagar with 14,75,524 members, Karimnagar with 10,58,837 members and Nalgonda with 10,45,305 members.
- And in Urban Telangana the top 3 highest number of illiterates were from Rangareddy with 5,10,184 members, Warangal with 1,85,698 members and Karimnagar with 1,67,189 members.
- The number of female illiterates was more than the male and transgender in Telangana.
- In Rural Telangana, Mahabubnagar district had 17% of illiterates of which maximum number of illiterates(6240) were from Makthal GP, and least(1) were in Rallacheruvu Thanda GP.
- In Urban Telangana, Rangareddy district had 34% of illiterates of which maximum number of illiterates(19126) were from Serilingampally Muncipality, and least(19) were in Ibrahimpatnam Muncipality.
- According to indiacensus.net, the top 3 highest illiterate districts of Telangana in the year 2023 are Jogulamba Gadwal(former Mahabubnagar), Narayanpet(former Mahabubnagar) and Nagarkurnool(former Mahabubnagar).
Result: Conducted in-depth analysis of the illiteracy rates in rural Telangana using data sourced from Open Data Telangana and analyzed the number of illiterates in 2014 and compared these statistics with the current year (2023) to gauge changes and trends in literacy rates over the years.
Conclusion: Even after 9 years, the district that was once known as Mahabubnagar has the highest percentage of illiterates in Telangana.
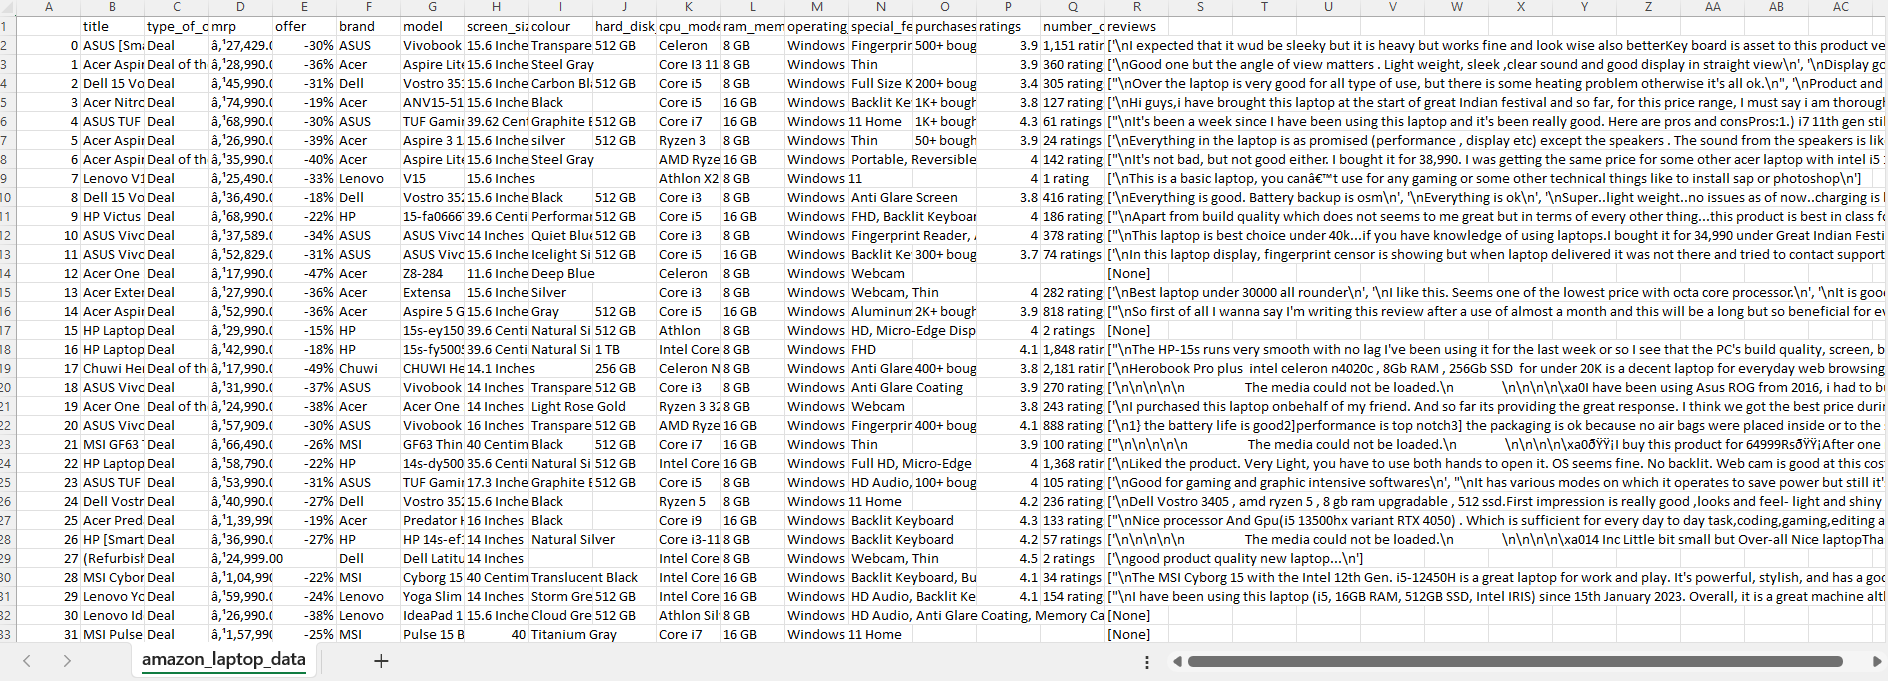
- Web Scraping and Data Extraction from Amazon.in for Electronic Gadgets
Objective: Collect comprehensive data on electronic gadgets commonly used by software employees or students, such as laptops, tablets, smartphones, smartwatches, headphones, earphones, and earbuds, during the Diwali season to especially emphasize the offer deals.
Data Source: The data is scrapped from ‘amazon.in’ website.
Dataset Description: Our required data from the webpage:
name: Title of the productbrand: Brand of the productmodel_name: Model name of the productscreen_size: Display size of the screencolour: Colour of the productcpu_model: CPU model of the productram_memory_installed_size: Installed size of ram memory in the productoperating_system: Operating System of the productmrp: Actual price of the productoffer: Offer on the productnumber_of_purchase_in_last_month: Number of purchases of the product in last monthnumber_of_ratings: Number of ratings received for the productrating: Overall rating of the product
Data Preperation: Required data was extracted from the webpage by finding the mentioned tags and if no such tag was found then that value is replaced with an empty string. Products having no title value were removed from the dataset and then saved as a csv file.
Libraries Used:
requests: Used for sending HTTP requests to websites to fetch the HTML content of web pagesBeautifulSoup (from bs4): Used for parsing the HTML content obtained using the ‘requests’ librarypandas: Used to create the DataFrame to organize and structure the scraped datanumpy: Used for numerical operations, especially in handling numerical data.
Data Snippet
Result: Was successfully able to web scrape the amazon.in data once before the header i used got blocked or restricted.
Conclusion: Got to know that the success of web scrapping depends on various factors:
Headers: Many websites require a valid user-agent string which allows/blocks/restricts the reuests.Website Policies: Some websites like amazon are having strict anti-scraping policies that are preventing or limiting scraping attempts.Website Changes: As we are relying on specific HTML tags to web scrape the data, sometimes our code might not be able to find the required HTML elements if the website changes its structure.